Open XrmToolBox and connect to your Project Operation, Install flow visio builder plug-in

look for the process you want to create visio file for and click on Create visio and install your process flow in visio format.

TOP 1 CRM BLOG
Open XrmToolBox and connect to your Project Operation, Install flow visio builder plug-in

look for the process you want to create visio file for and click on Create visio and install your process flow in visio format.
Go to solutions and open the entity that contains the field you want to make read only and click on Business Rules and Click New.

The Business Rule designer window opens with a single condition already created for you. Every rule starts with a condition. The business rule takes one or more actions based on that condition

Add a description, if you want, in the description box in the upper-left corner of the window.
Add conditions. To add more conditions to your business rule:
a. Drag the Condition component from the Components tab to a plus sign in the designer.

b. To set properties for the condition, click the Condition component in the designer window, and then set the properties in the Properties tab on the right side of the screen. As you set properties, an expression is created at the bottom of the Properties tab.
c. To add an additional clause (an AND or OR) to the condition, click New in the Properties tab to create a new rule, and then set the properties for that rule. In the Rule Logic field, you can specify whether to add the new rule as an AND or an OR.

d. When you’re done setting properties for the condition, click Apply.
Add actions. To add an action:
a. Drag one of the action components from the Components tab to a plus sign next to Condition component. Drag the action to a plus sign next to a check mark if you want the business rule to take that action when the condition is met, or to a plus sign next to an x if you want the business rule to take that action if the condition is not met.

b. To set properties for the action, click the Action component in the designer window, and then set the properties in the Properties tab.
c. When you’re done setting properties, click Apply.
To save the business rule, click Save on the action bar.
To activate the business rule, select Activate on top of the screen.
When you create a work flow and face a problem with the output is displaying HTML code like the image below:

there are multiple ways you can use to fix this issue. One of the solutions is using the expression Replace in your flow to replace the HTML code seek the example below:
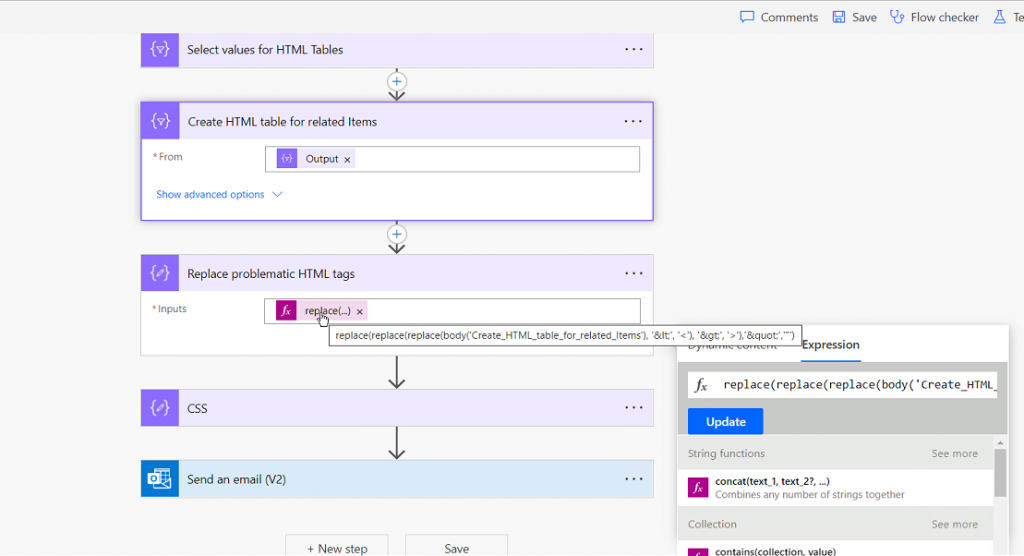
the expression used in this example is: replace(replace(replace(body(‘Create_HTML_table_for_related_Items’), ‘<’ , ‘<‘ ), ‘>’, ‘>’), ‘"’, ‘ ” ‘)
after that add the output of your expression inside the CSS compose

To Integrate your created tasks in Ms Project inside the tasks tab in Power Automate you have to clone your Ms Project template.
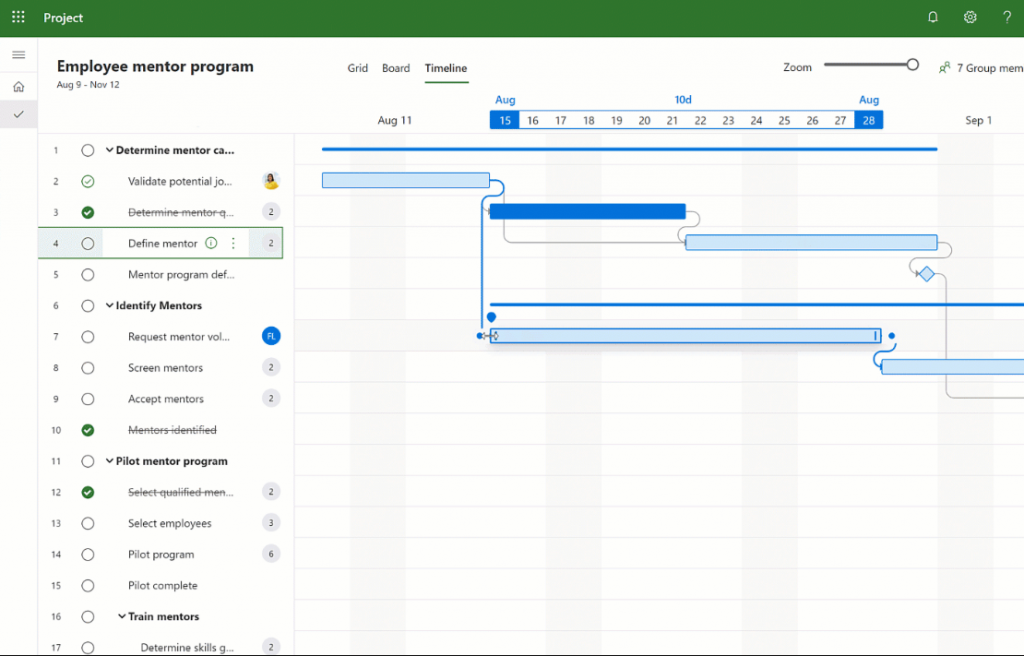

To add styling to your email notification you have to create a compose action in your flow

and then place your CSS inside the action

Finally place output of compose CSS and output of the created HTML table

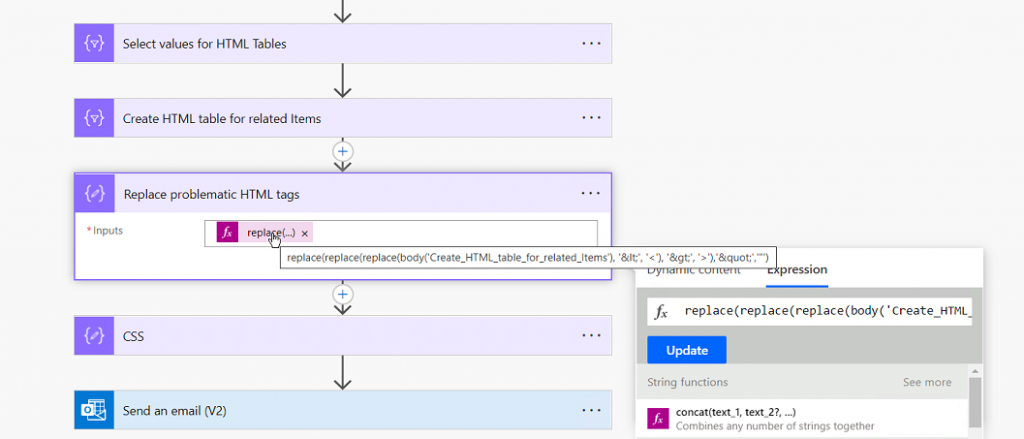
the function used in this example is: replace(replace(replace(body(‘Create_HTML_table_for_related_Items’), ‘<’ , ‘<‘ ), ‘>’, ‘>’), ‘"’, ‘ ” ‘)
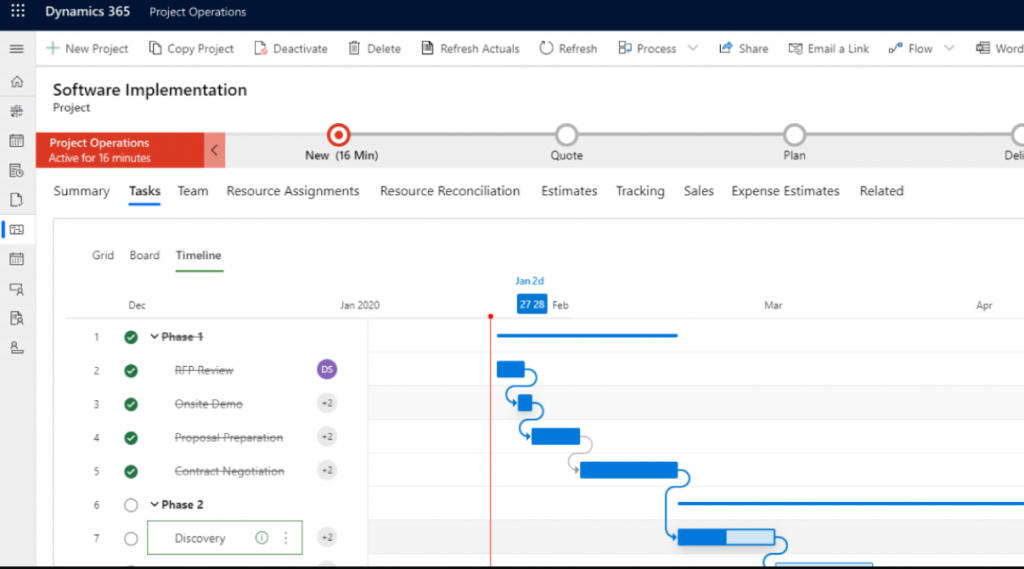
Using Project Operations you can create an automated Gantt Charts, and I will be showing you how to do it.
Project Operations has a simplified, drag and drop project scheduling tool. It includes dashboards, task management, scheduling, interactive Gantt charts, and work-breakdown structures.
First you have to open Project Operations in Dynamics 365 and click Projects in the left side bar

Click New Project and this window will appear

Fill up the fields with the correct informations and then click the Tasks tab
Write the tasks, assign them and give every task a duration of time and your Grantt chart will be created automatically in the Timeline tab based on what information you’ve provided.
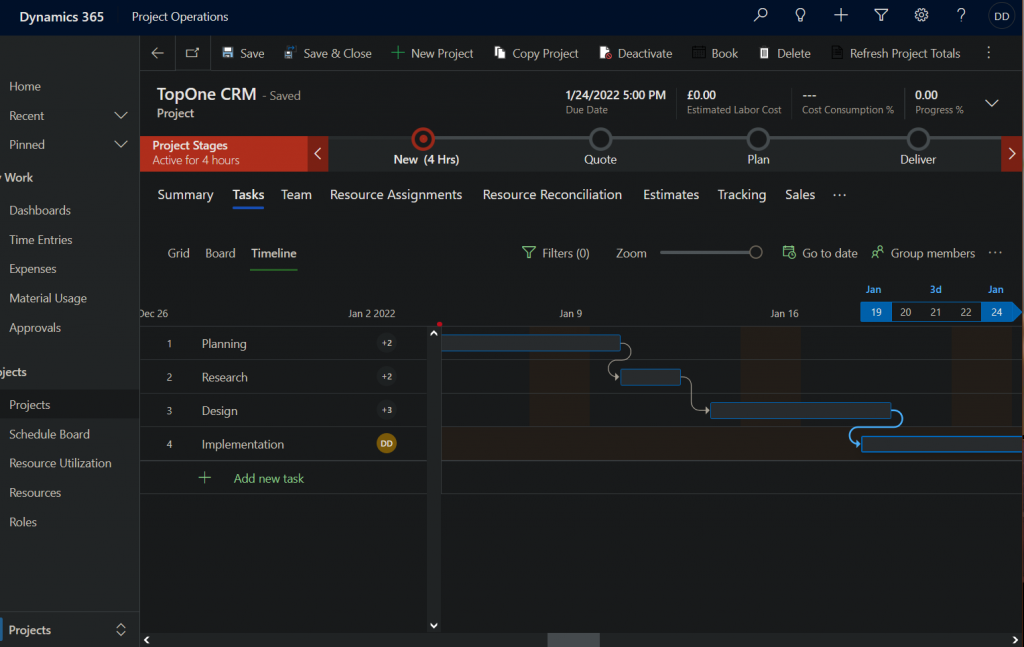
You can drag the rectangle to adjust the task duration.
Sometimes when you click on the Tasks tab it won’t load your tasks
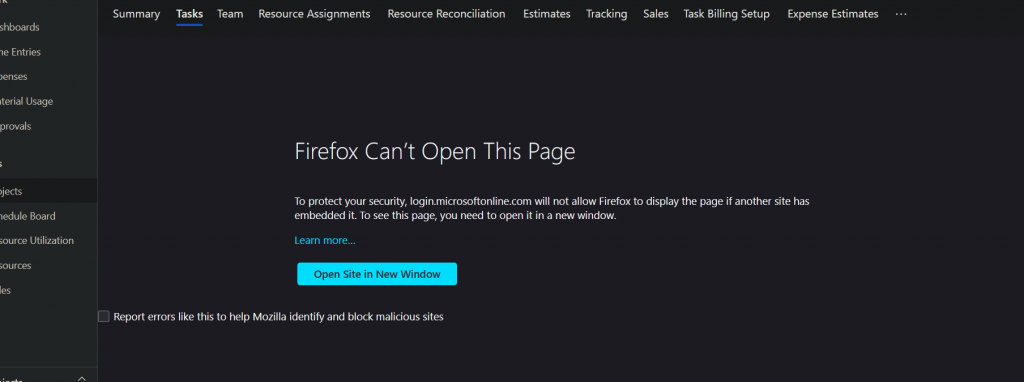
All you have to do is click on open site in New Window and sign in again to your account, you will be redirected to Dynamics 365 Project
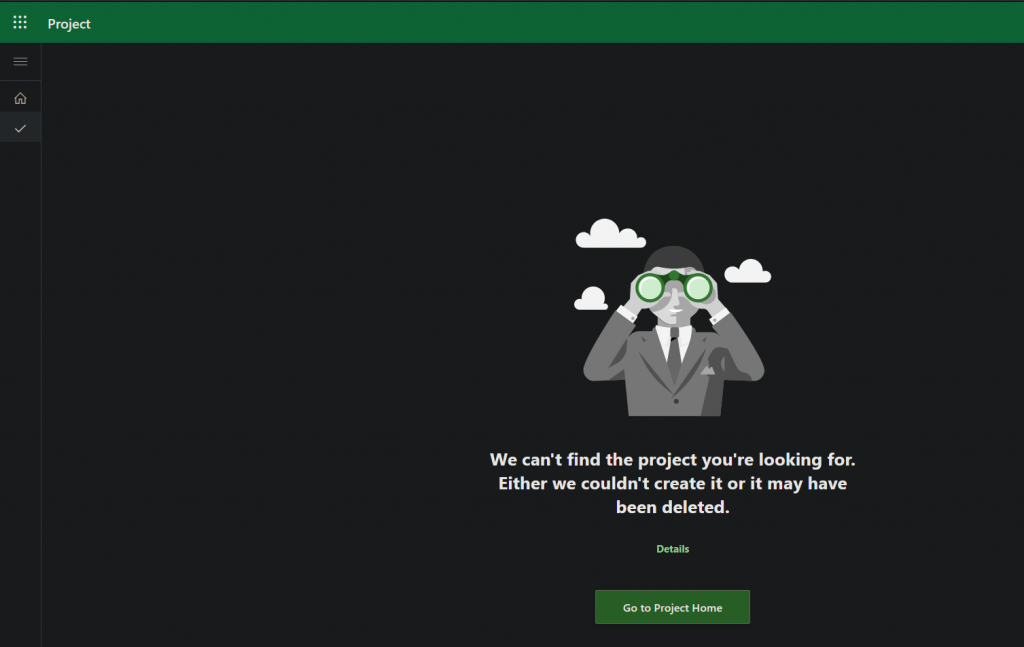
When this page appears click on Go to Project Home and then click on the name of your project where you want to create the Grantt Chart.
Your project will open and the Tasks tab will work properly.
Ganntchart is a project management tool that illustrates a project plan. It has two main sections: the left side outlines a list of tasks, while the right side has a timeline of work. Inorder to create ganntchart in project-operations, first we need to have a project to manage. Below is simple steps used to follow to create ganntchart.
go to the projects tab in the project operations environment, create new project and fill some essential general fields. For example:
| project-name | web-project |
| Description | Develop website for ABC University |
| Customer | ABC University |
| Project Manager | John Doe |
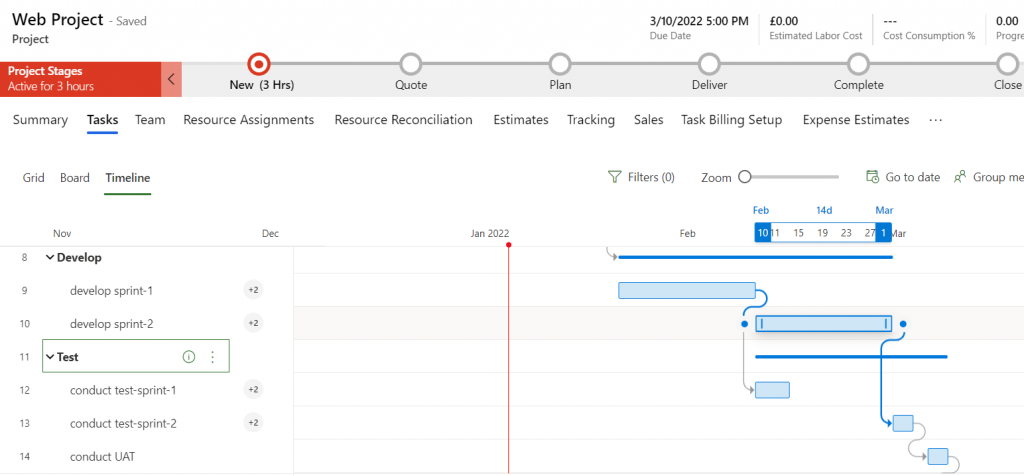
Given a project is created, now add tasks related to your project. Our example web project has many tasks and subtasks. Below is a table showing the tasks and associated subtaks.
| Task | Subtask |
| Analysis | identify use cases create user stories conduct techincal and finacial feasiblity |
| Design | create low fidelity prototype create high high fidelity prototype |
| Development | develop sprint-1 develop sprint-2 |
| Test | conduct test-sprint-1 conduct test-sprint-2 conduct UAT test |
| Deliver | deploy to azure |
Once tasks are completed, go to team tab and add team-members needed to compelte your project. In our demo example we have the following team-members working on the sample web-project.
| Profession | Employee-name |
| Business analyst | Abel Alemu |
| Software Designer | Markos Alemu, Thomas |
| Software Developer | George, Yonas Alemu |
| Software Tester | Sara Alemu, Helen Alemu |
Once tasks are created and team-members are populated, now it’s time to assign task to each team-member. Below is a screenshot from our demo example of web-project.
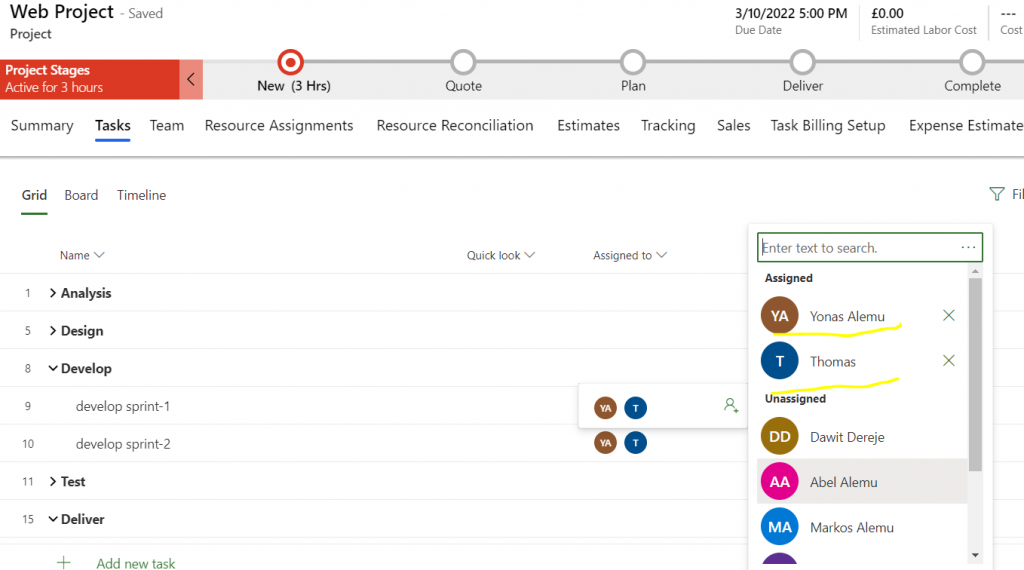
Given one task is dependent on another task, this stage is crucial for effective project managment below is a screenshot from our example. It shows once test-sprint-1 is dependent on sprint-1-development. And test-sprint-2 is dependent on sprint-2-development. And UAT (User Acceptance Testing) is dependent on both test-sprint-2.
These are the simple steps to follow to create the gannt-chart. gannt chart has the following advatages when it comes to project managment:
Power Automate, is an useful online tool for creating automated workflows between apps and services to synchronize files, get notifications, and collect data within the Microsoft 365 application.
An automation can be quickly and easily created, only a basic understanding of Office 365 is required to a create basic automation
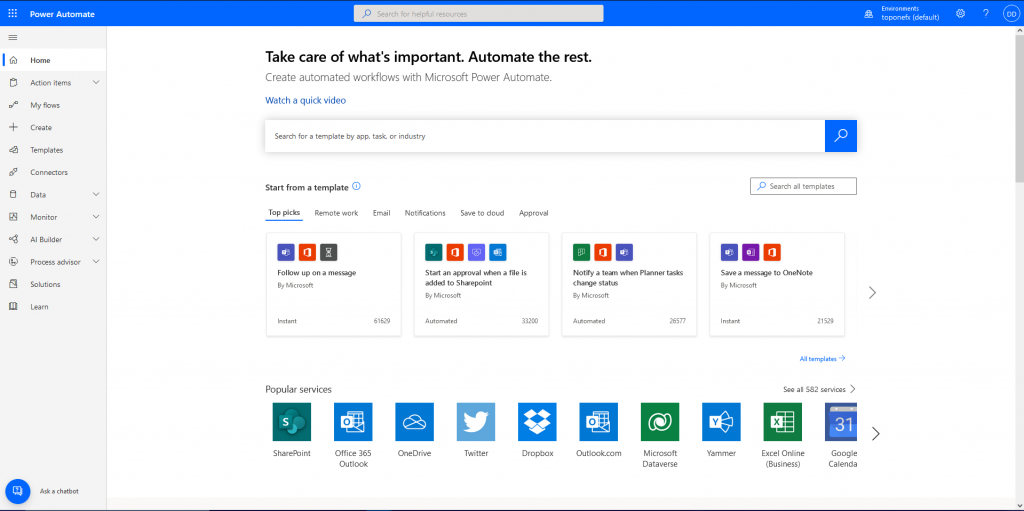
Visit the Power Automate Website https://unitedkingdom.flow.microsoft.com/en-us/ and sign in with an Microsoft account. After that is done the Power Automate Home page will be displayed.
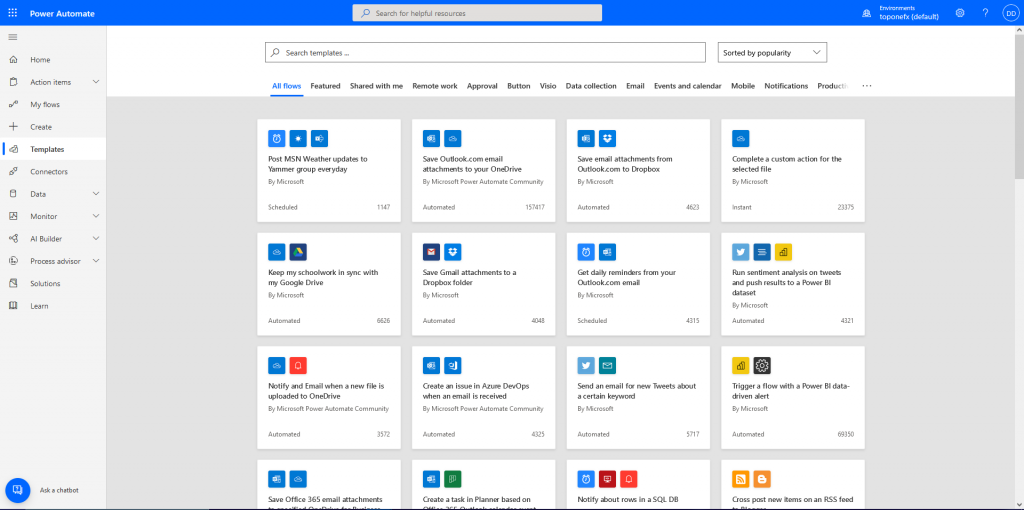
A new workflow can be created from scratch if a specific workflow needs to be made or a existing template can be taken from the Templates page making the creating workflow process easier.

This template will be used for demonstration. Any files attached to a email going to this Gmail account will be automatically saved to a Google Drive account. The user adds the email addresses of the Gmail and Google Drive accounts that the workflow will connect to for the automation to work.
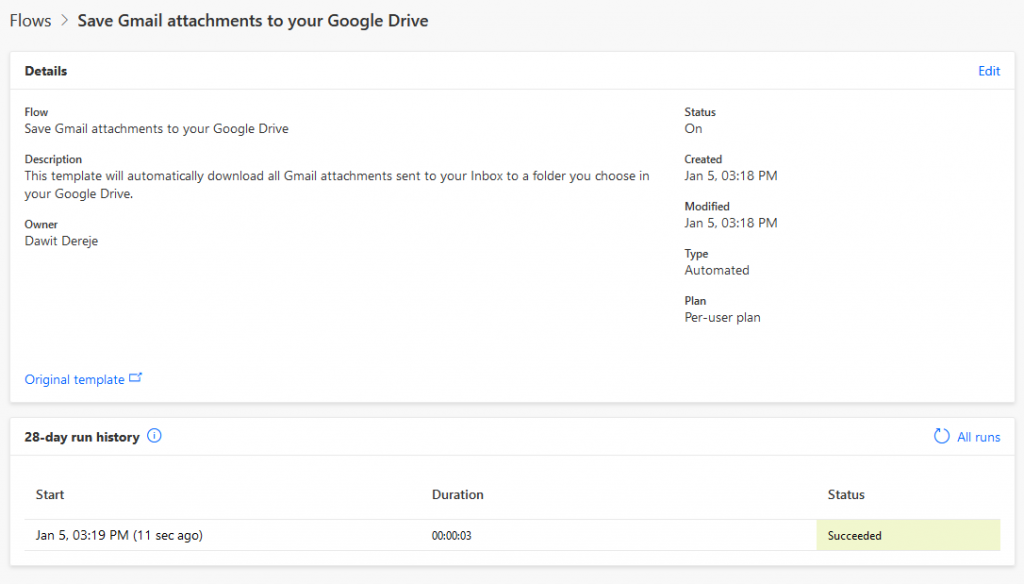
When the flow is created the details of the workflow will be displayed showing information such as the title, description, who created the workflow, when the workflow is created and etc. A history of the workflow’s run are displayed at the bottom providing the results of each run showing whether they were successful or not.
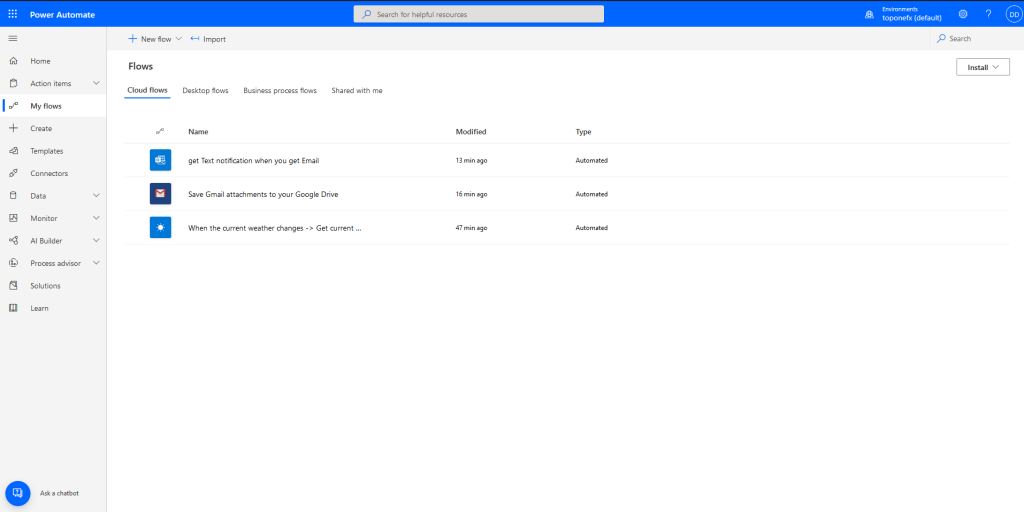
All workflows that the user has created is shown on the My Flows page.
In case someone hasn’t seen yet “Dynamics 365 Implementation Guide”. It is 706 pages book, but it is interesting and worth reading. Our top one part is about security and how Microsoft Dynamics 365 is protecting users.
Dynamics 365 Implementation Guide (d365implementationguide.com)

Cypress is an end-to-end testing framework for web test automation. It enables us to write automated web tests in JavaScript.
Cypress is universal because it’s written in JavaScript and uses Node.js when running in browsers. It’s simple to set up and its fast when it comes to debugging, and if the tests fail, you will be provided with suggestions for how to fix the defect.
open up the IDE and add the code below
describe(‘My First Test’, () => { it(‘Does not do much!’, () => { expect(true).to.equal(true) }) })after you save the file, run it using the following command in your terminal
npx cypress runthe cypress command log will pop up , click on the name of your file and you will see the following

Cypress also exposes a shortcut for debugging commands, .debug().
The current subject that is yielded by the cy.get() is exposed as the variable subject within your Developer Tools so that you can interact with it in the console.

Use .debug() to quickly inspect any (or many!) part(s) of your application during the test. You can attach it to any Cypress chain of commands to have a look at the system’s state at that moment.