Using Project Operations you can create an automated Gantt Charts, and I will be showing you how to do it.
Project Operations has a simplified, drag and drop project scheduling tool. It includes dashboards, task management, scheduling, interactive Gantt charts, and work-breakdown structures.
Steps to create a Gantt Chart
First you have to open Project Operations in Dynamics 365 and click Projects in the left side bar
Click New Project and this window will appear

Fill up the fields with the correct informations and then click the Tasks tab
Write the tasks, assign them and give every task a duration of time and your Grantt chart will be created automatically in the Timeline tab based on what information you’ve provided.
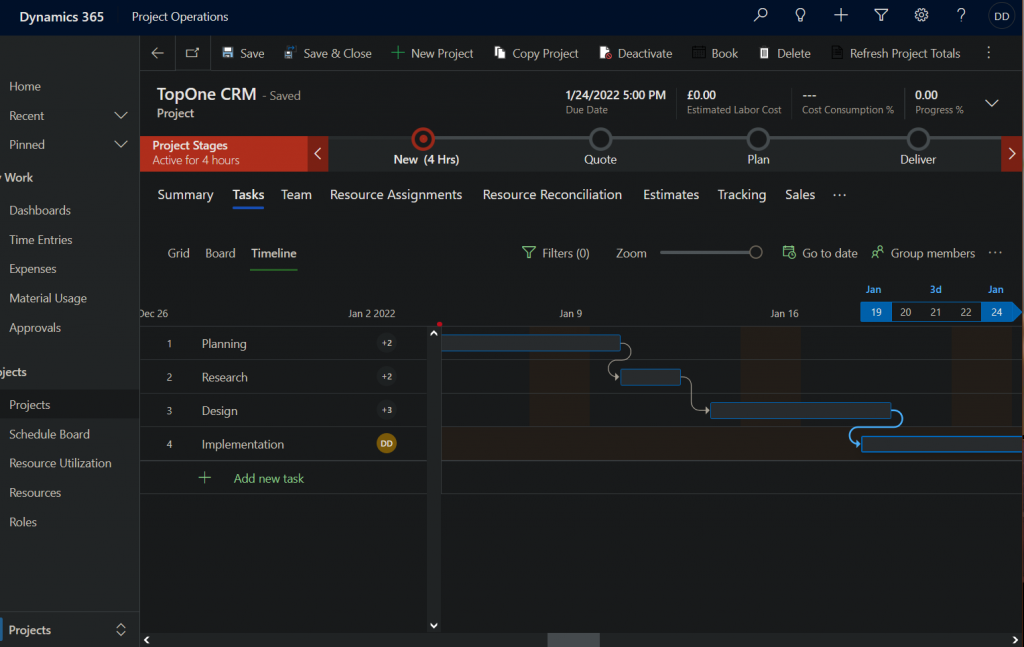
You can drag the rectangle to adjust the task duration.
Problems you might face
Sometimes when you click on the Tasks tab it won’t load your tasks
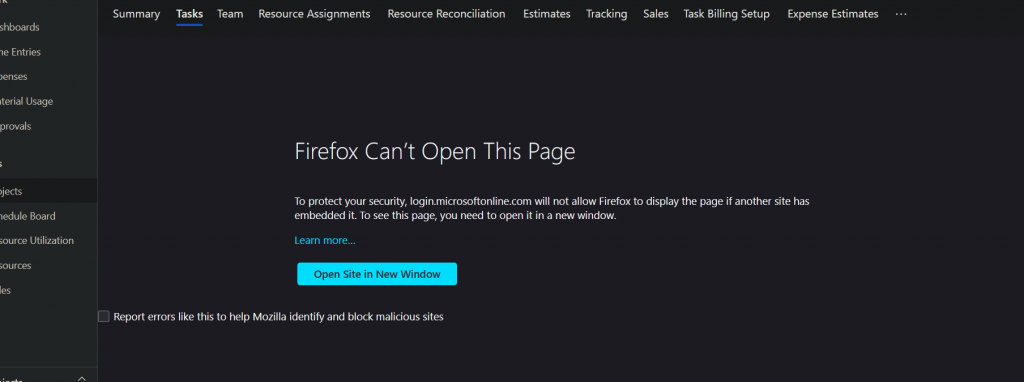
All you have to do is click on open site in New Window and sign in again to your account, you will be redirected to Dynamics 365 Project
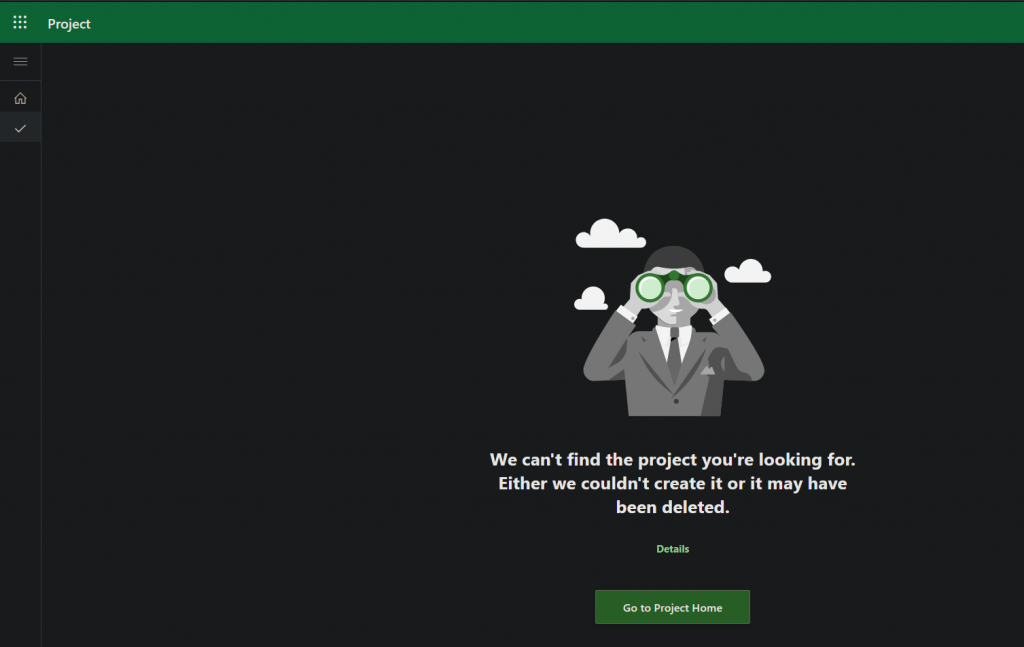
When this page appears click on Go to Project Home and then click on the name of your project where you want to create the Grantt Chart.
Your project will open and the Tasks tab will work properly.