Ganntchart is a project management tool that illustrates a project plan. It has two main sections: the left side outlines a list of tasks, while the right side has a timeline of work. Inorder to create ganntchart in project-operations, first we need to have a project to manage. Below is simple steps used to follow to create ganntchart.
1) create project:
go to the projects tab in the project operations environment, create new project and fill some essential general fields. For example:
| project-name | web-project |
| Description | Develop website for ABC University |
| Customer | ABC University |
| Project Manager | John Doe |
2) add tasks to the project:
Given a project is created, now add tasks related to your project. Our example web project has many tasks and subtasks. Below is a table showing the tasks and associated subtaks.
| Task | Subtask |
| Analysis | identify use cases create user stories conduct techincal and finacial feasiblity |
| Design | create low fidelity prototype create high high fidelity prototype |
| Development | develop sprint-1 develop sprint-2 |
| Test | conduct test-sprint-1 conduct test-sprint-2 conduct UAT test |
| Deliver | deploy to azure |
3) create a team for the project
Once tasks are completed, go to team tab and add team-members needed to compelte your project. In our demo example we have the following team-members working on the sample web-project.
| Profession | Employee-name |
| Business analyst | Abel Alemu |
| Software Designer | Markos Alemu, Thomas |
| Software Developer | George, Yonas Alemu |
| Software Tester | Sara Alemu, Helen Alemu |
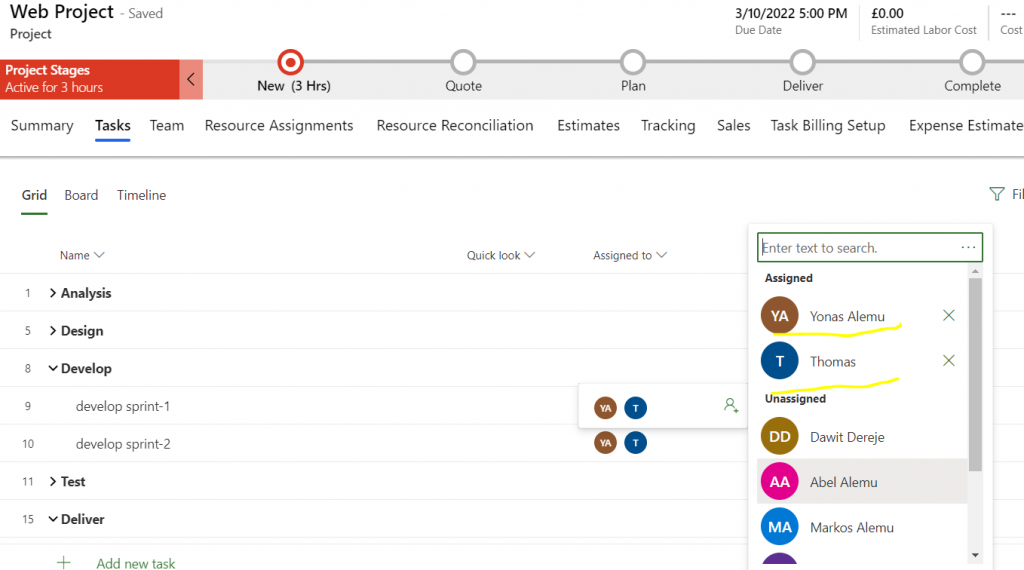
4) Assign task to each employee/team-member
Once tasks are created and team-members are populated, now it’s time to assign task to each team-member. Below is a screenshot from our demo example of web-project.
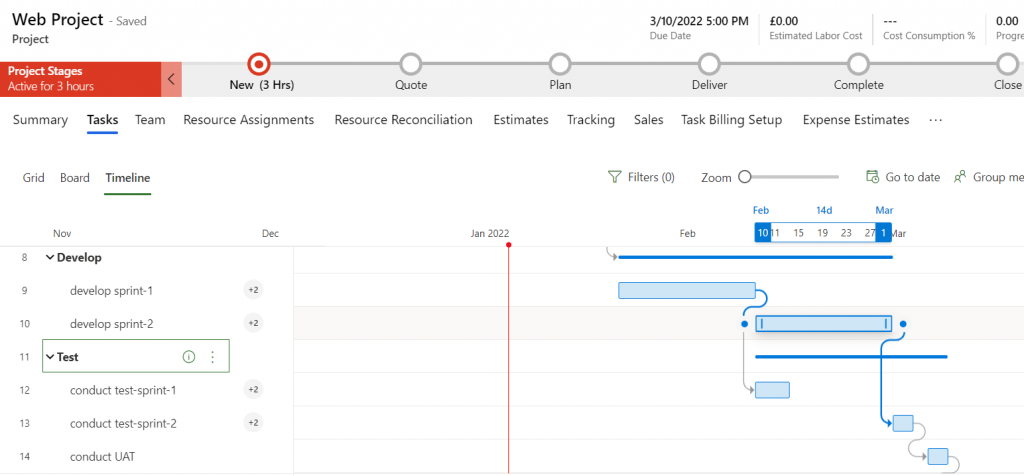
5) Manage dependency using the timeline
Given one task is dependent on another task, this stage is crucial for effective project managment below is a screenshot from our example. It shows once test-sprint-1 is dependent on sprint-1-development. And test-sprint-2 is dependent on sprint-2-development. And UAT (User Acceptance Testing) is dependent on both test-sprint-2.
These are the simple steps to follow to create the gannt-chart. gannt chart has the following advatages when it comes to project managment:
- it helps to determines resources and task dependencies
- it monitors the progress of the project